metabolomics Archive — Page 1 of 1

Abstract green and blue digital network with glowing grid lines, data points, and layered wave-like forms around a dark central area.
May 18, 2015

Tools for exploring ‘omics’ data

The NetGestalt computing portal integrates vast amounts of data to aid users in finding biologically and clinically relevant information.

Older woman with short white hair in the foreground, with a younger woman standing blurred behind her.
April 30, 2015

Study team uses metabolomics to study longevity

The keys to longevity have been a source of curiosity and the basis of many research studies for years, yet the mechanisms underlying a person’s ability to live a long life are still not fully understood.

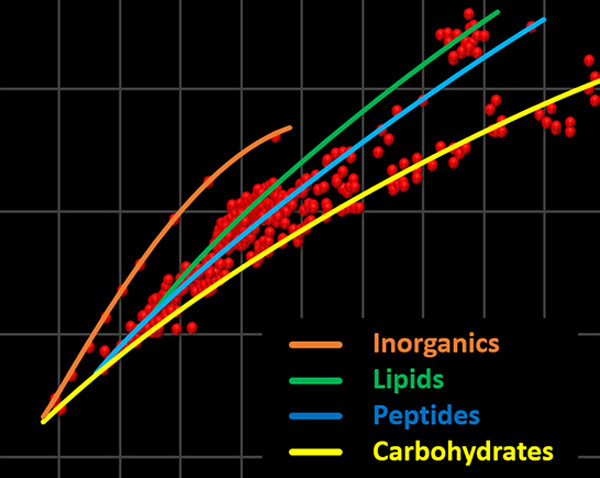
Scatter plot with red data points and colored trend lines labeled “Inorganics,” “Lipids,” “Peptides,” and “Carbohydrates.”
March 10, 2015

Symposium on impact of ‘omics on medicine set for March 23

Vanderbilt and the Waters Centers of Innovation Program are sponsoring a free symposium titled “Integrated ‘Omics in Translational Medicine” on March 23. It is open to all scientists interested in the subject.

Abstract green and blue digital network with glowing grid lines, data points, and layered wave-like forms around a dark central area.
July 25, 2013

Visualizing data on network ‘maps’

The new web application NetGestalt will allow investigators to simultaneously visualize different types of data for the same gene – such as mutation, expression and modification.